i2c OLED on up board 4000
13 Mar 2023I bought the Up-board Up 4000 a couple of weeks ago as I was looking for a small form factor x64 cluster node to run rancher to controll and manage my k3s cluster. So, after what feels like an eternity, I finally was able to make some progress and display some system stats on an I2C OLED.
After googleing forever and by fluke I came across the oled-i2c-bus NodeJS driver and had some initial success displaying system stats on the OLED. Here is the initial NodeJS sample that worked:
var i2c = require('i2c-bus'),
    i2cBus = i2c.openSync(1),
    oled = require('oled-i2c-bus');

var font = require('oled-font-5x7');

var opts = {
    width: 128,
    height: 64,
    address: 0x3C
};

var oled = new oled(i2cBus, opts);

oled.turnOnDisplay();
oled.clearDisplay();
oled.setCursor(1, 1);
oled.writeString(font, 1, 'Hello World', 1, true);
Since I am a python guy (I created a python based installation package for the Raspberry Pi to display system information on an 128x32 OLED), I asked chatGPT to convert the above NodeJS script to python. Believe it or not, chatGPT came through, and spat out a python script that basically worked (needed some customization to do what I wanted it to do). Here is the chatGPT suggested python code:
from smbus2 import SMBus
from luma.oled.device import ssd1306
from luma.core.render import canvas
from luma.core.interface.serial import i2c

serial = i2c(port=1, address=0x3C)
device = ssd1306(serial, width=128, height=64)

device.show()
with canvas(device) as draw:
    draw.rectangle(device.bounding_box, outline="white", fill="black")
    draw.text((1, 1), "Hello World", fill="white")
The key to success was the chatGPT suggested to use the luma.oled python library. This python library finally allowed me to control and display the info I wanted on the OLED.Not yet 100% perfect but definitely a step in the right direction. I will keep you posted.
Here is the code I used (btw on stock Ubuntu 22.04 with python3 and the respective libraries installed via pip):
#!/usr/bin/python3
from smbus2 import SMBus
from luma.oled.device import ssd1306
from luma.core.render import canvas
from luma.core.interface.serial import i2c
import subprocess
from PIL import Image, ImageDraw, ImageFont
width = 128
height = 32
serial = i2c(port=1, address=0x3C)
device = ssd1306(serial, width=width, height=height)
# Make sure to create image with mode '1' for 1-bit color.
image = Image.new("1", (width, height))
# Get drawing object to draw on image.
draw = ImageDraw.Draw(image)
# Draw a black filled box to clear the image.
draw.rectangle((0, 0, width, height), outline=0, fill=0)
# Draw some shapes.
# First define some constants to allow easy resizing of shapes.
padding = -2
top = padding
bottom = height - padding
# Move left to right keeping track of the current x position for drawing shapes.
x = 0
# Load font.
font = ImageFont.truetype("/usr/share/fonts/truetype/msttcorefonts/arial.ttf", 10)
#Get the system stats to be displayed on the OLED
cmd = "hostname -I | cut -d' ' -f1"
IP = subprocess.check_output(cmd, shell=True).decode("utf-8")
cmd = 'cut -f 1 -d " " /proc/loadavg'
CPU = subprocess.check_output(cmd, shell=True).decode("utf-8")
cmd = "free -m | awk 'NR==2{printf \"Mem: %.2f%% of \" ,$3*100/$2}' && free -hm | awk 'NR==2{printf \"%s\", $2}'"
MemUsage = subprocess.check_output(cmd, shell=True).decode("utf-8")
cmd = 'df -h | awk \'$NF=="/"{printf "Disk: %d/%d GB %s", $3,$2,$5}\''
Disk = subprocess.check_output(cmd, shell=True).decode("utf-8")
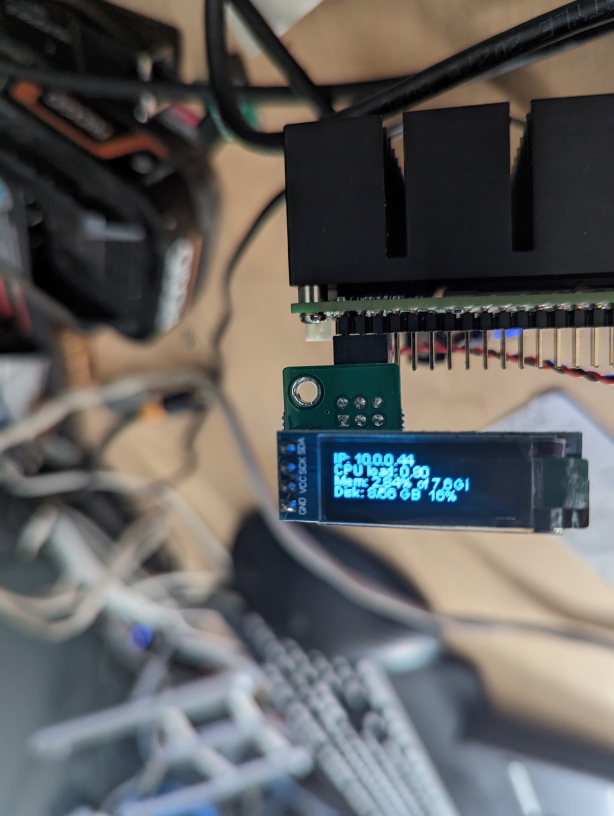
#Display the stats on the OLED
while True:
with canvas(device) as draw:
draw.text((x, top + 0), "IP: " + IP, font=font, fill=255)
draw.text((x, top + 8), "CPU load: " + CPU, font=font, fill=255)
draw.text((x, top + 16), MemUsage, font=font, fill=255)
draw.text((x, top + 24), Disk, font=font, fill=255)
I keep at it. Let me know if you have any feedback or suggestions to this method.